Current market commentary
Since the start of the year, almost all asset classes have risen, driven by falling bond yields, fewer inflation concerns, China optimism, the absence of a gas shortage in Europe and new risk budgets for investors. The moves were further amplified by systematic strategies that demanded equities due to better momentum and falling volatility. Markets could overshoot further in the short term as many strategies remain underinvested and could be pushed into the market accordingly. The big loser was the US dollar, which weakened across the board. However, positioning against the euro in particular is already very pessimistic, so the depreciation momentum is likely to diminish, at least in the short term. In the medium term, we think that market participants will look less at inflation figures and more at growth figures again. In view of the threat of a US recession, volatility is likely to rise again in the course of the year.
Short-term outlook
The Q4 reporting season will occupy the markets for the next few weeks. By mid-February, around 80% of S&P 500 companies will report by market cap. The S&P 500 is expected to see its first year-on-year earnings decline in the fourth quarter since 2020 and profit margins are likely to fall. Corporate earnings for the STOXX 600, on the other hand, are expected to rise year-on-year. The Bank of Japan meeting will also take place on 18 January. On Tuesday, industrial production data (Dec.) and Q4 economic growth for China will be released, as well as the German ZEW Economic Sentiment Index (Jan.) and the US Empire State Manufacturing Index (Jan.). UK inflation data (Dec.) as well as retail sales (Dec.), producer prices (Dec.) and industrial production (Dec.) will follow on Wednesday. On Thursday, the ECB meeting minutes (Dec.), US housing data and the Philadelphia Fed Index (Jan.) will be published.
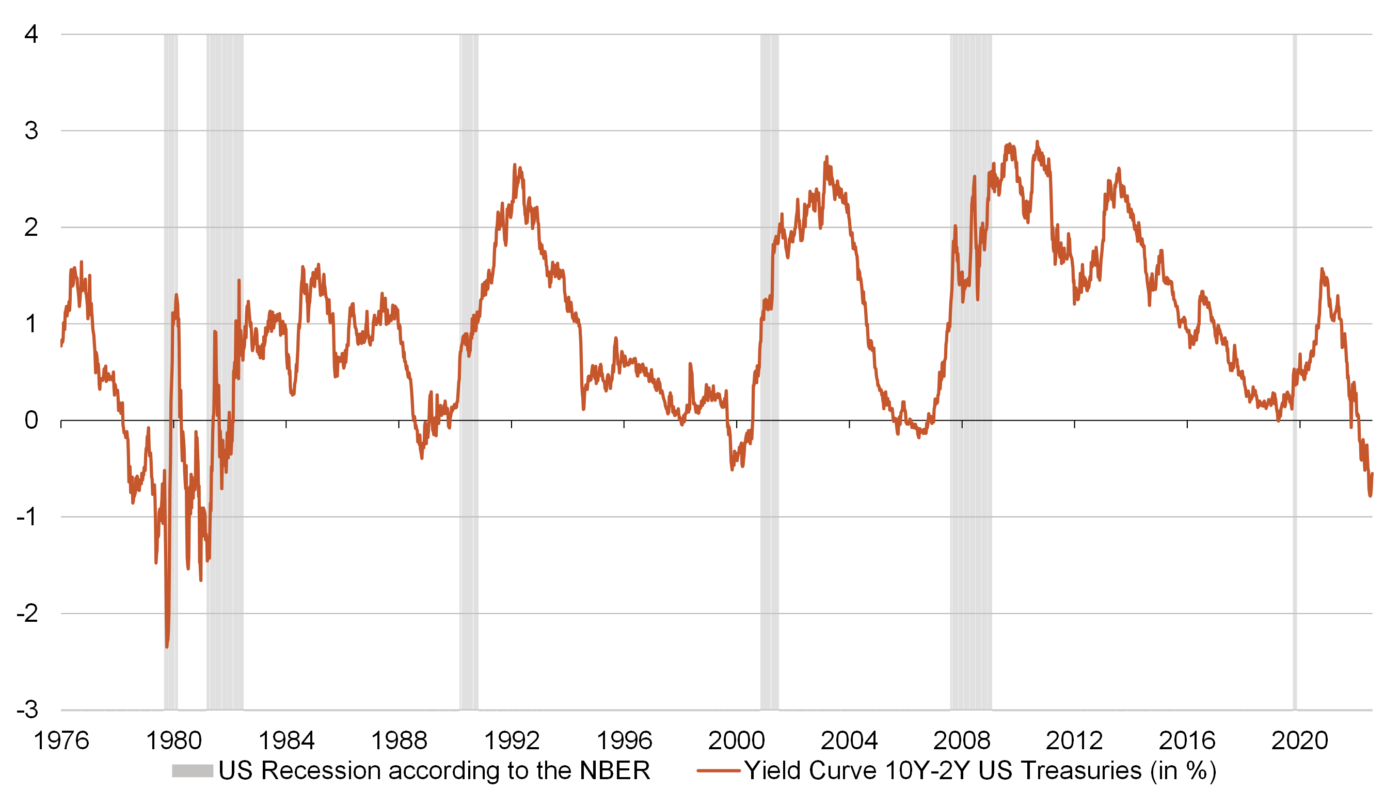
Strongly inverted US yield curve suggests steepening soon

- Following the Fed's big rate hikes in the fight against inflation, the interest rate differential between 10-year and 2-year US Treasuries has inverted to -66bp, which is the 3rd percentile since the 1970s.
- In the past, an inverted yield curve was always followed by a recession. Interest rate cuts by central banks to stimulate the economy have then led to a normali-sation of the yield curve. We expect the yield curve to steepen again this time.
