Since the interest rate turnaround in 2022, the bond market has experienced a renaissance. Since then, short-term investments have offered an adequate return. However, the European Central Bank (ECB) and other central banks are now back to cutting interest rates and the yield curves are normalising again. The attractiveness of yields on overnight and fixed-term deposits is fading quickly in comparison to bond investments. We believe that medium-term maturities (3-7 years) represent the sweet spot in the coming months. In the following pages, we explain what has caused the departure from the low interest rate environment, what influence central banks have on the yield curve and why this is important for portfolio positioning.
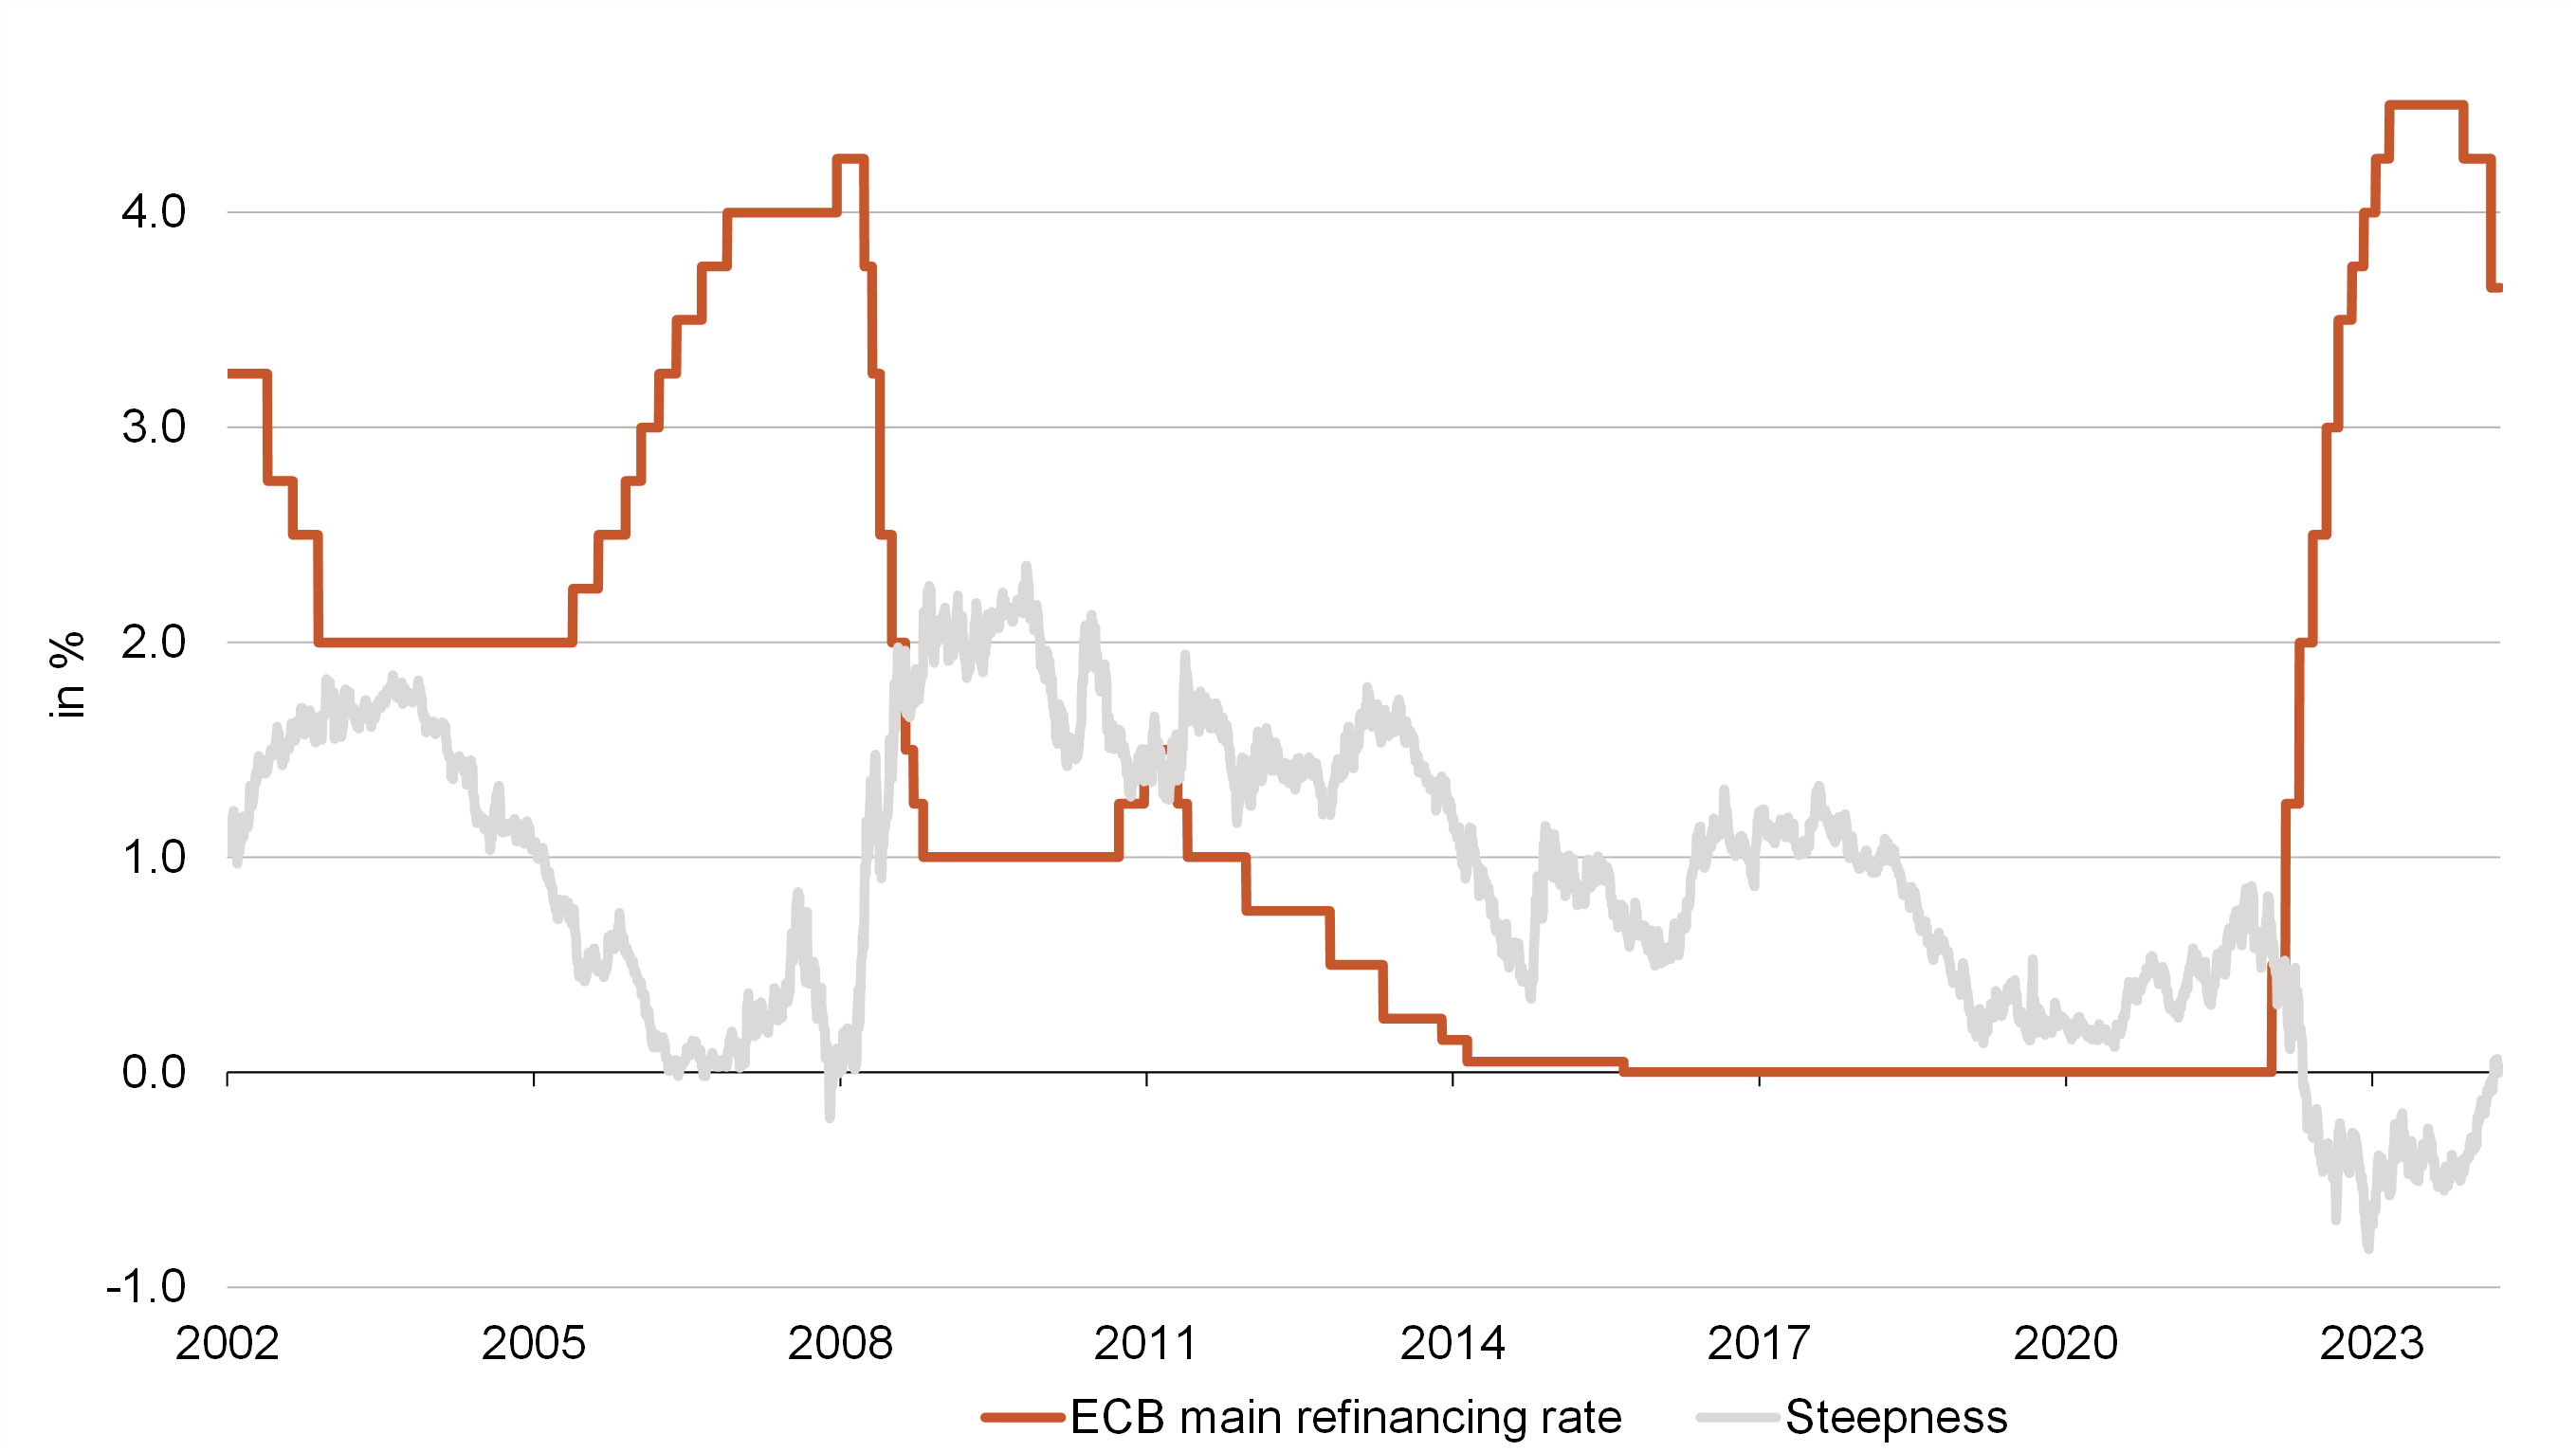
On 21 July 2022, the ECB declared a turnaround in interest rates and ended the era of negative deposit rates for banks at the ECB with the first key interest rate increase of 0.5% in over a decade. This came as no surprise, as out-of-control inflation rates forced the members of the ECB Governing Council to take this step. After the refinancing rate reached a high of 4.5% in September 2023, the first cut followed in June 2024, followed by two more in the autumn. The situation is similar at other major central banks, with the Bank of England cutting for the first time in August, and the Swedish Riksbank, Bank of Canada and the Swiss National Bank also making three cuts. The Federal Reserve (Fed) followed suit in September 2024 with a cut of 50bp (see Figure 1).
In addition to the interest rate cut in September, a technical change to the interest rate corridor (difference between the deposit rate and the main refinancing rate) also came into force. The ECB Governing Council decided to reduce this from 50bp to 15bp in order to better manage the money market. The ECB is still providing the financial market with a great deal of liquidity through open-market operations but is gradually reducing this. The narrower corridor is intended to curb volatility on the money market when liquidity decreases. With this decision, the main refinancing rate was reduced by 60bp in September, of which 25bp was accounted for by the interest rate cut and 35bp by the change in the gap between the deposit and refinancing rate.
Figure 1: The interest rate cutting cycle has already begun in many places
Most ECB Governing Council members believe that the elevated inflation figures are a thing of the past, and some also emphasised growing concerns about the inflation target of 2% per year being undershot (due to weak economic data). This means that nothing stands in the way of further interest rate cuts. However, the speed of the cuts and how far they will go remain unclear. If there is no major recession in the eurozone, interest rates could only be cut to the level of the “neutral interest rate”. Philip Lane, the ECB’s chief economist, currently estimates this to be between 1.5-2%, while other ECB Governing Council members estimate it to be between 2-2.5%.
To achieve price stability, the central bank attempts to create a balance between supply and demand on various markets. If the key interest rate is too restrictive, there is a risk of recession; if it is too expansive, there is a risk of the economy overheating. The neutral interest rate, also known as the equilibrium rate, is precisely the interest rate at which the economy is neither stimulated nor slowed down.
The policy rate as the main instrument of central banks
The ECB’s primary objective is to ensure price stability in the eurozone. Other objectives, such as supporting general economic policy or promoting a competitive, social market economy with full employment, are subordinate to this. One of the most important instruments for achieving this is the policy rate. It serves as an anchor point for the yield curve, which assigns an interest rate to each capital commitment period.
Policy rates have a stronger influence on short-term interest rates. Longer maturities, on the other hand, are dependent on the inflation and growth expectations of the respective countries. The creditworthiness of countries or other political risks, on the other hand, can have an equal impact on all maturities. The liquidity of bonds tends to decrease with increasing maturity. This is because longer maturities are subject to a higher interest rate risk, as the market value of longer bonds reacts more sensitively to interest rate changes and banks therefore must deposit more risk capital for longer bonds.
A look into the past: three yield curve scenarios
The “normal case” is a rising yield curve. In addition to the current short-term interest rate, the so-called term premium is also considered here. It describes the premium that investors demand for the interest rate risk if they make their capital available to governments and companies for a long period of time. Interest rates should therefore be higher for longer maturities than for shorter ones. Inflation and growth expectations naturally also play an important role here. The higher the inflation and growth expectations for the coming years, the steeper the curve could be, as the lender would otherwise lose real purchasing power. This was the case for German government bonds in 2014, for example, while the short-term interest rate was 0 %, the interest rate for 10 years was over 100bp and even 200bp higher for 30 years (see dark grey line in Figure 2). This shape is consistent with the premium for the longer capital commitment period.
In the low interest rate environment in the years before 2022, the yield curve was very flat. Access to cheap capital and the prospect of interest rates remaining low indefinitely enabled governments and companies to take out very long-term loans. One example of this is Austria. In 2020, the Republic issued a bond with a coupon of 0.85% and a term of 100 years. This is an interest rate that borrowers can only dream of today, even with significantly shorter terms. We find an exemplary illustration of this regime in 2019: yields on German government bonds were identical and negative across almost all maturities, with interest rates only rising towards 0% for very long maturities (see light grey line in Figure 2). This is partly because the financial market did not rule out a normalisation of the interest rate environment in the very long term and partly because there was still a term premium, even if it was very low, and this led to positive yields in the very long term.
With the increase in key interest rates in July 2022 and the expectation of a key interest rate hike soon, (risk-free) interest rates rose significantly across all maturities and in the following year, short-term interest rates were even higher than long-term interest rates – the German yield curve had been inverted for a long time since then (see orange line in Figure 2). It is only in the last few weeks that the German yield curve has returned to a slightly positive slope between two and 10 years.
Figure 2: Bunds have experienced all three scenarios in the last 10 years
A rising curve is the normal case, while flat or inverted curves can be a warning signal. In 2019, however, the flat curve was characterised by the narrative of a persistently low interest rate environment.
The inverted yield curve – a challenge for the real economy
A persistently inverted yield curve can be problematic for an economy, as the interests of the supply and demand sides then diverge sharply. Investors achieve a higher return with less risk by lending their capital at short notice. Companies, on the other hand, value predictability. As a rule, it is better for them if loans are longer term so that they do not run the risk of falling into arrears at certain points and they already know the interest charges for the coming years.
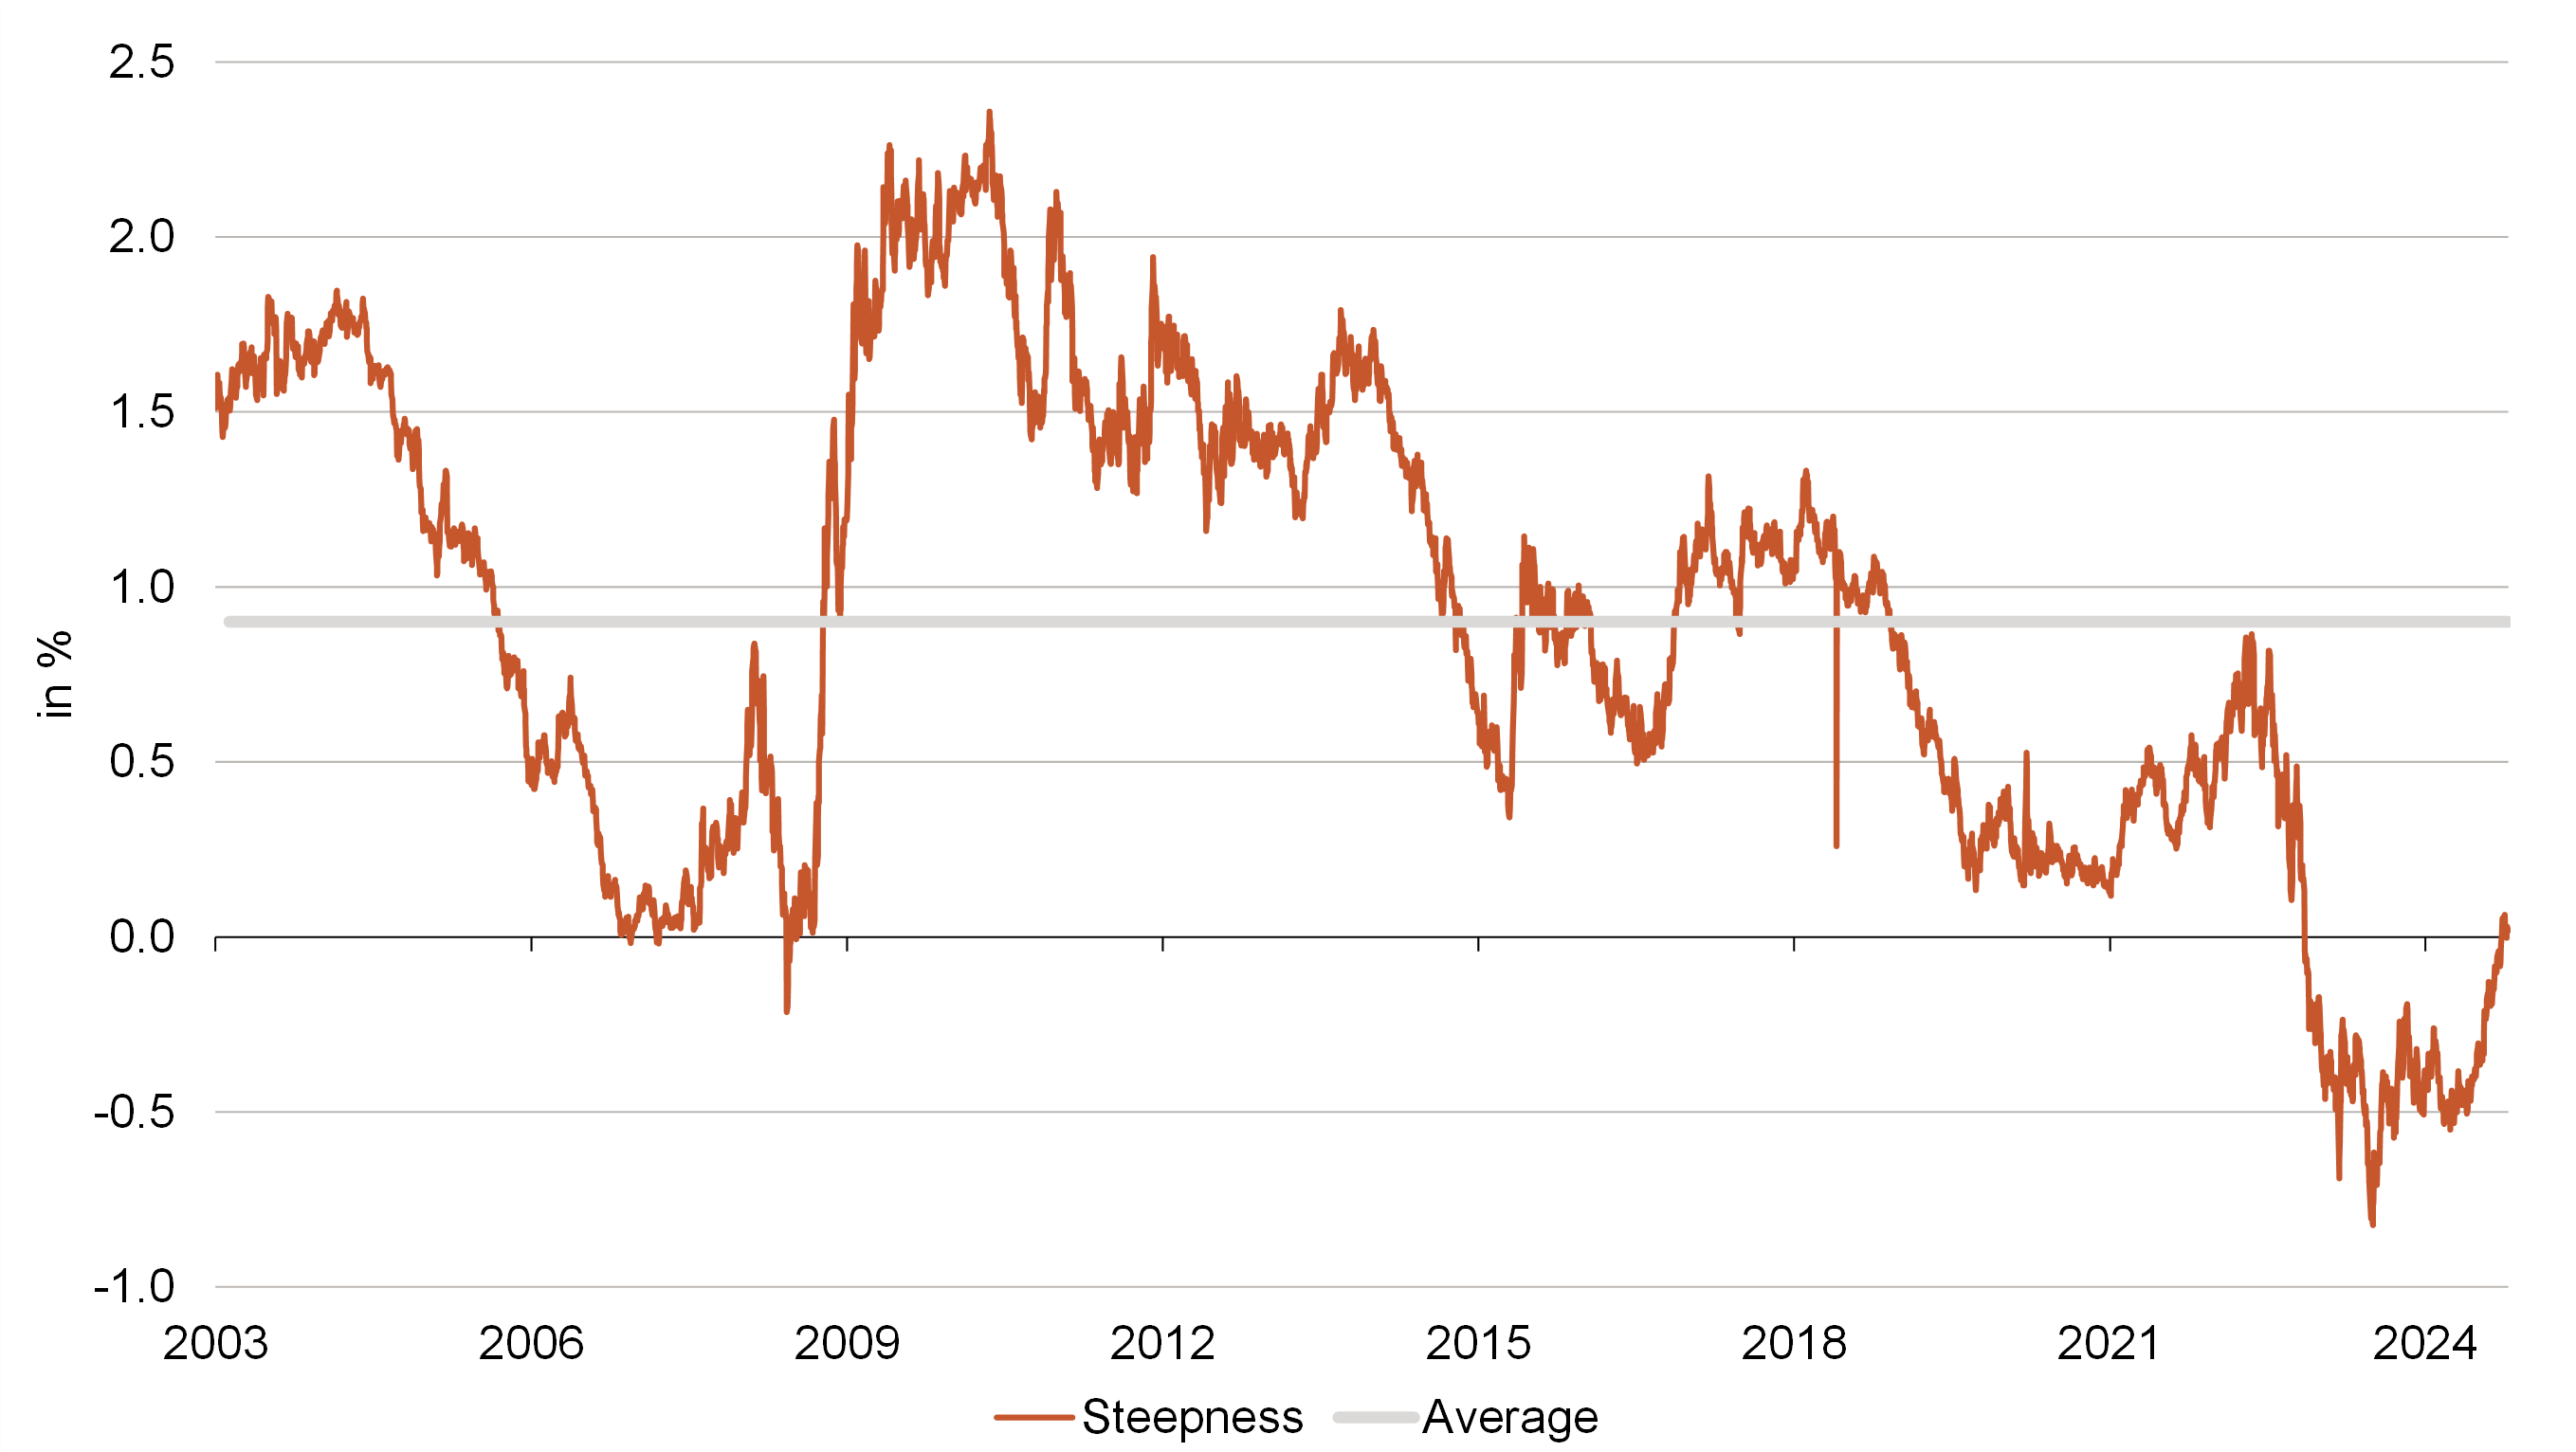
In addition, an inversion of the yield curve has often preceded a recession in the past. In Germany, the curve between two and 10 years had been inverted since November 2022 and the difference reached its highest negative value in July 2023 (see Figure 3). In mid-September 2024, the slope turned positive again for the first time, lasted just over two weeks and has been oscillating at around zero ever since. However, a serious recession in the coming months does not seem very likely from today’s perspective. Economic output in the eurozone was only slightly negative in Q4 2023 at -0.1% compared to the previous quarter, and grew again by 0.3% in Q1 2024.
Figure 3: Yields on two-year Bunds were stubbornly above 10-year yields for a long period of time
This is another reason why the current interest rate cutting cycle could be different from previous ones. The ECB is lowering the policy rate because inflation expectations have cooled down and not because of a (sharp) contraction in economic output. Even if the data is volatile, the macroeconomic indicators for the eurozone point to weak, but positive growth in the coming quarters. In addition, expansionary fiscal policy in many of the EU member states, as well as increased military spending, costs for the green transition and other structural issues, could fuel inflation (expectations) again. Although there are significant differences from country to country, in terms of the EU this means that the ECB could cut less than in previous cycles and is unlikely to pursue an expansionary monetary policy to support the economy.
Market expectations remain volatile
Against this backdrop, financial markets monitor macroeconomic indicators very closely and when data outside of expectations is published, this often leads to a reinterpretation and therefore a more significant change in market expectations for the key interest rate and therefore also longer-term interest rates. Market expectations for the key interest rate are priced through the trading of futures contracts. At the turn of the year, six to seven interest rate cuts by the ECB, ie a total of 164bp in cuts, were still priced in for 2024. However, these cuts were largely priced out again due to good economic data. In July, there were only two interest rate cuts (excluding the 25bp rate cut that had already taken place at that time). During the summer months, fears of a hard landing for the US economy increased, the upturn that had previously emerged in Europe lost momentum and inflation rates continued to fall. This in turn led to more expected interest rate cuts, with a further 2.5[%?] rate hikes[hike?] (-65bp) priced in at the end of August. As a result, yields on short and longer-term interest rates also fell (see Figure 4). In the second step, however, the yield curve should normalise further and not all maturities could perform well in the coming months.
Figure 4: Changes in interest rate cut expectations influence short-term interest rates
Both the expected policy rate for the end of 2024 and the short-term interest rates for German government bonds have fallen again since the middle of the year after rising in the first half of 2024.
But what exactly is a “normal” yield curve?
Like the neutral interest rate, the appropriate steepness is not a constant value; it changes daily based on changes in the future outlook. As already described, it depends on inflation and growth expectations, among other things. However, other factors such as government debt or political instability can also play a role. In the period between the introduction of the euro and today, the average slope between two-year and 10-year German government bonds was 90bp. This means that the 10-year interest rate was on average 90bp higher than the two-year interest rate. In the US, the data series is somewhat longer, with an average of 84bp since 1976. An assumption of normal steepness between 80-100bp therefore seems appropriate (see Figure 5).
Figure 5: The long-term average steepness is significantly higher than today’s levels
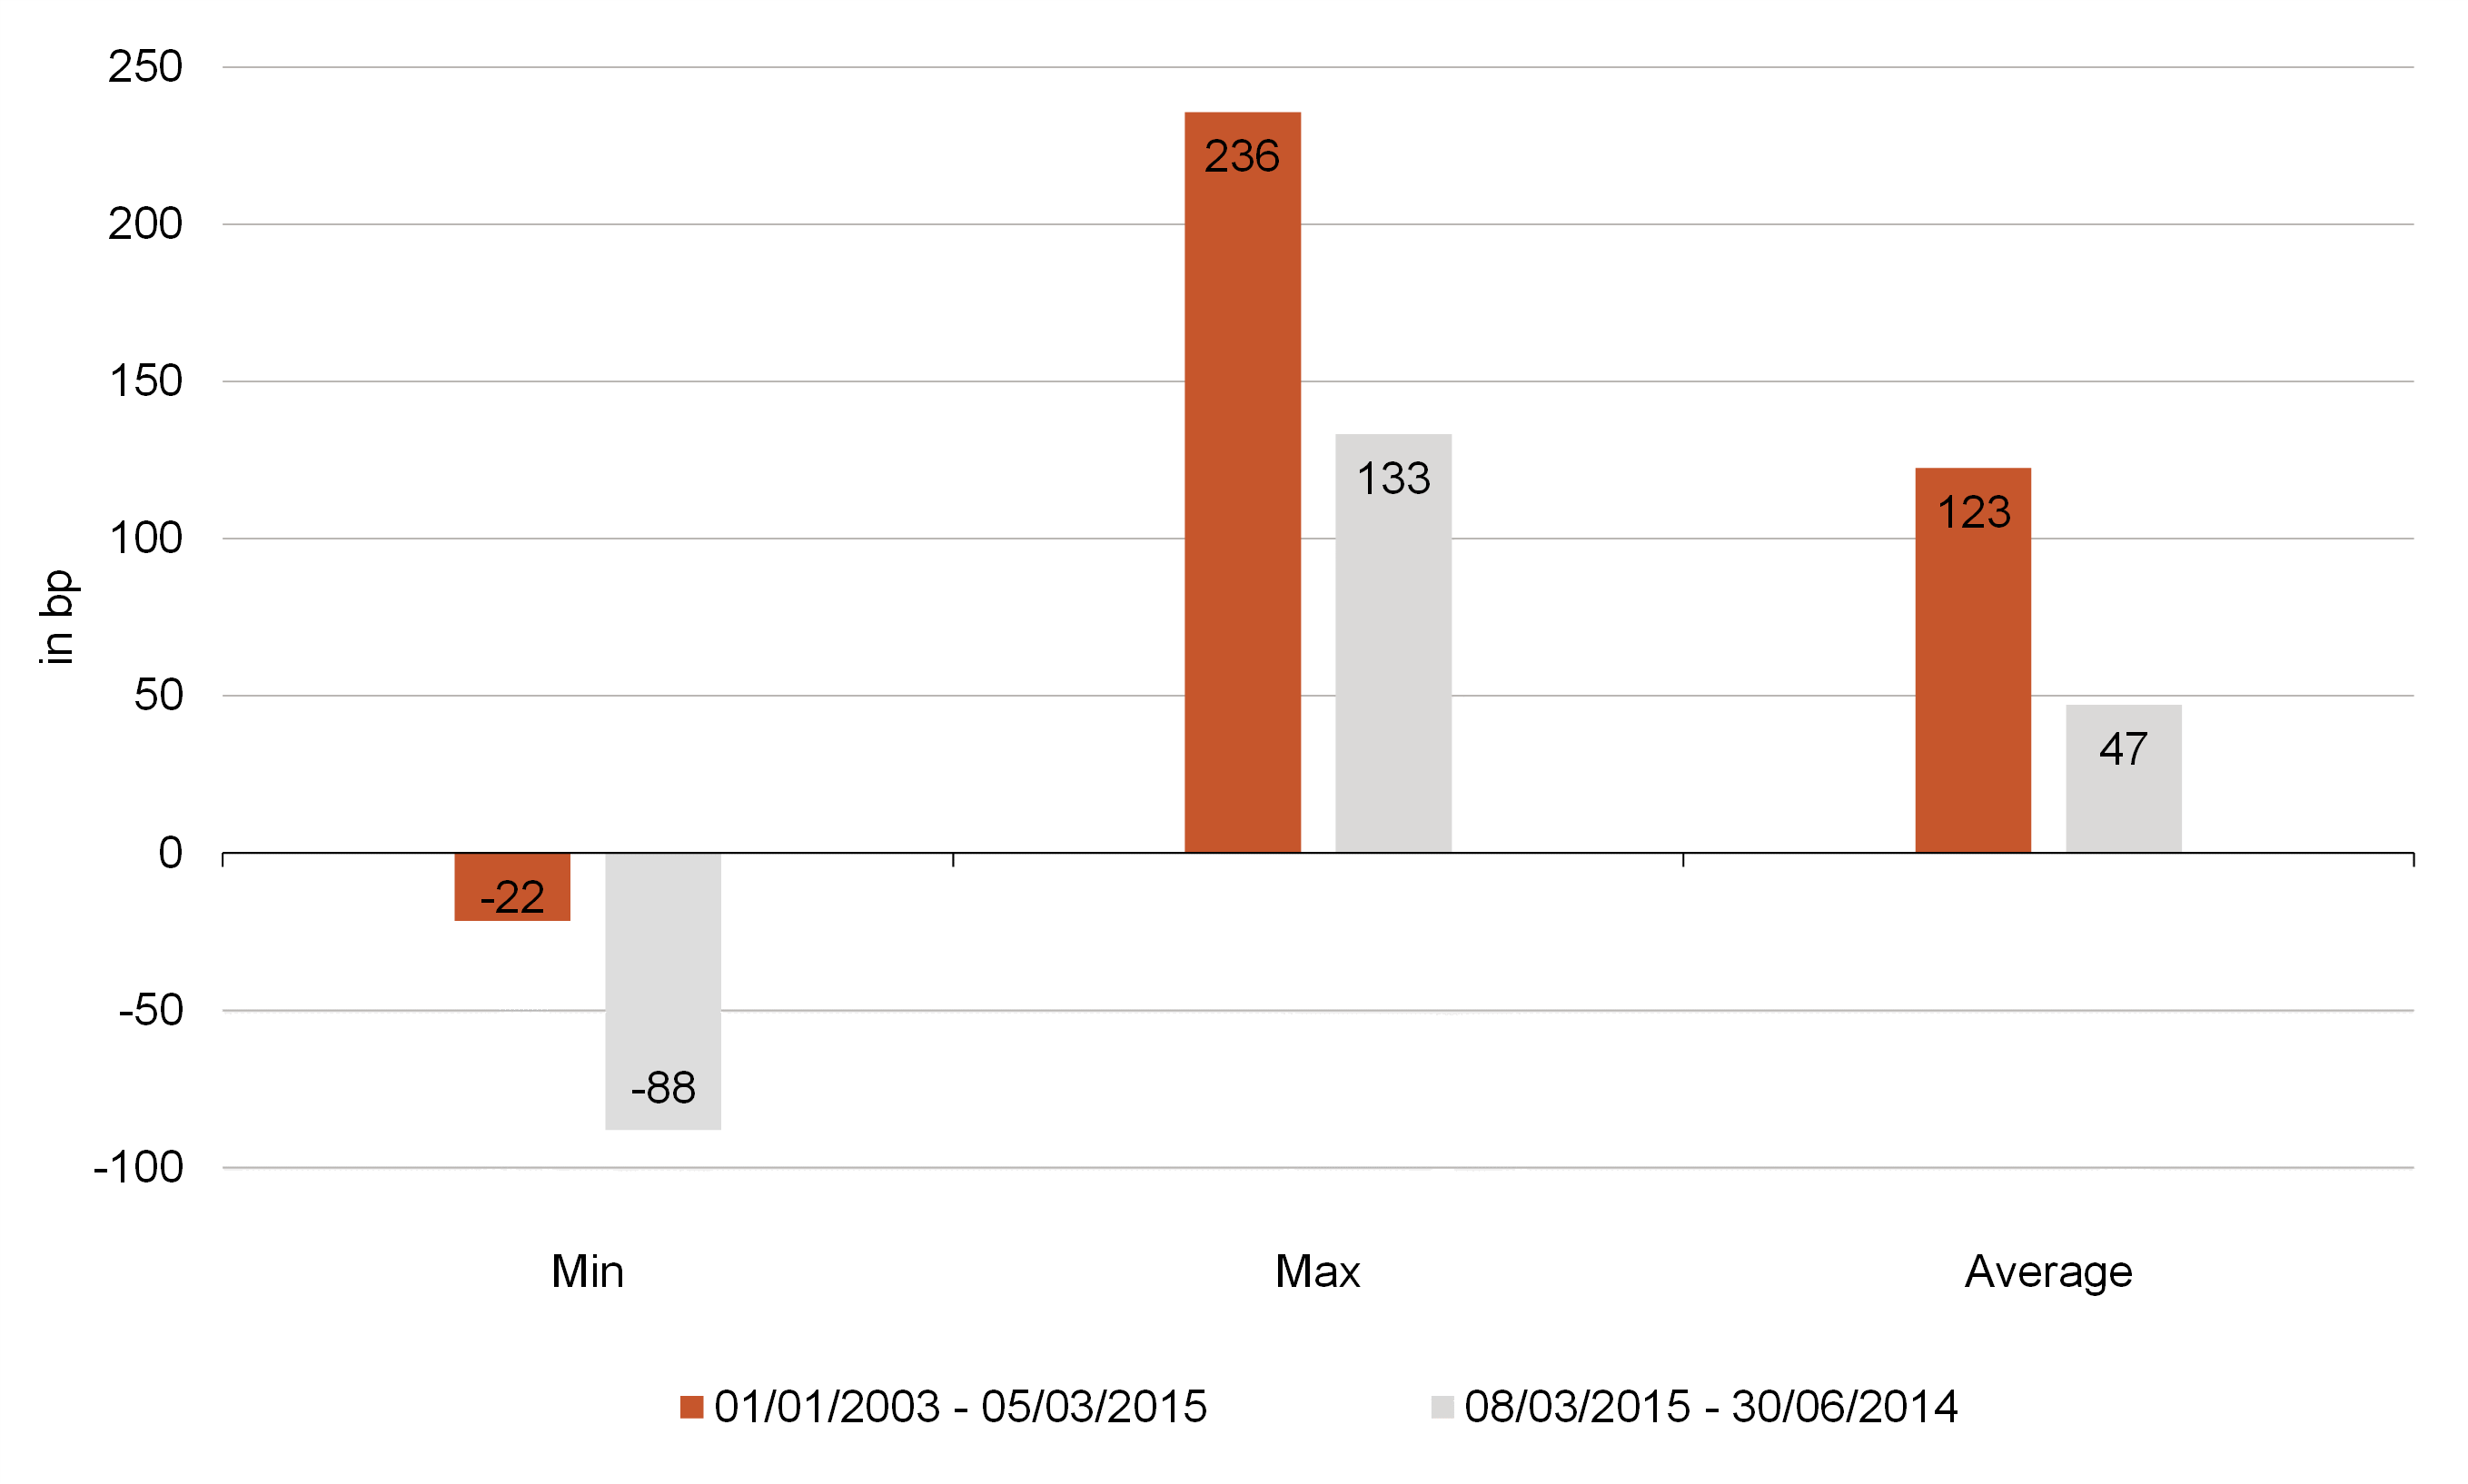
In order to obtain a more accurate picture, this period can be divided into different regimes. A useful distinction is the period before and since the ECB began quantitative easing. When central banks engage in quantitative easing, they buy bonds with different maturities. In this way, they provide the financial market with additional liquidity. The increased demand leads to lower yields for the maturities purchased by the central banks. During this phase, the slope may also have been distorted. In the first period from the beginning of 2002 to the beginning of March 2015, the average steepness was 123bp, while in the period from the beginning of March 2015 to mid-June 2024 it was 47bp (see Figure 6). The long-term average of the slope between two and 10 years could therefore also be slightly higher than the 80-100bp mentioned above.
Figure 6: Different monetary policy regimes led to different slopes in the past
Implications for duration positioning
The ECB is in the middle of the rate-cutting phase, but the speed and final target remain uncertain. However, due to the weakening economy in Germany and other EU member states, the ECB feels no pressure to keep interest rates high. In addition, the yield curve has already started to normalise. In the last two years, it has been easy to receive adequate yields with little/no interest rate risk via overnight and term deposits. As long-term interest rates are now higher than short-term rates again, this no longer appears to be the best strategy. Anyone who ties up their capital for a few months now will probably have to reinvest at lower interest rates in a few months’ time. Overall, the return could therefore be significantly lower than initially thought. To benefit from the current interest rate, it makes sense to take a look at medium and long-term interest rates right now.
However, this is only one of the income components of bonds. In addition to the current interest mentioned above, bonds can also generate price effects (provided they are not held to maturity). These occur when the interest rate level or the risk premium changes. The longer the outstanding term of the bond, the more sensitively it reacts to this change. This sensitivity to changes in the interest rate level is measured using the duration. This is a measure of the average period for which the capital in the bond is tied up. In the case of a bond with a coupon of zero, the duration corresponds exactly to the term, as the entire capital is tied up until maturity. However, if the bond pays a positive coupon, the duration is lower than the term, as the coupon payment means that money flows back before maturity. The higher the duration, the greater the price effect when the underlying interest rate changes. A simplified example using a zero-coupon bond illustrates this: If the yield curve shifts downwards in parallel by 100bp, the price of a bond with a duration of one (ie maturing in approximately one year) will rise by 1%, but the price of a bond with a duration of 10 (ie maturing in approximately 10 years) will rise by 10%.
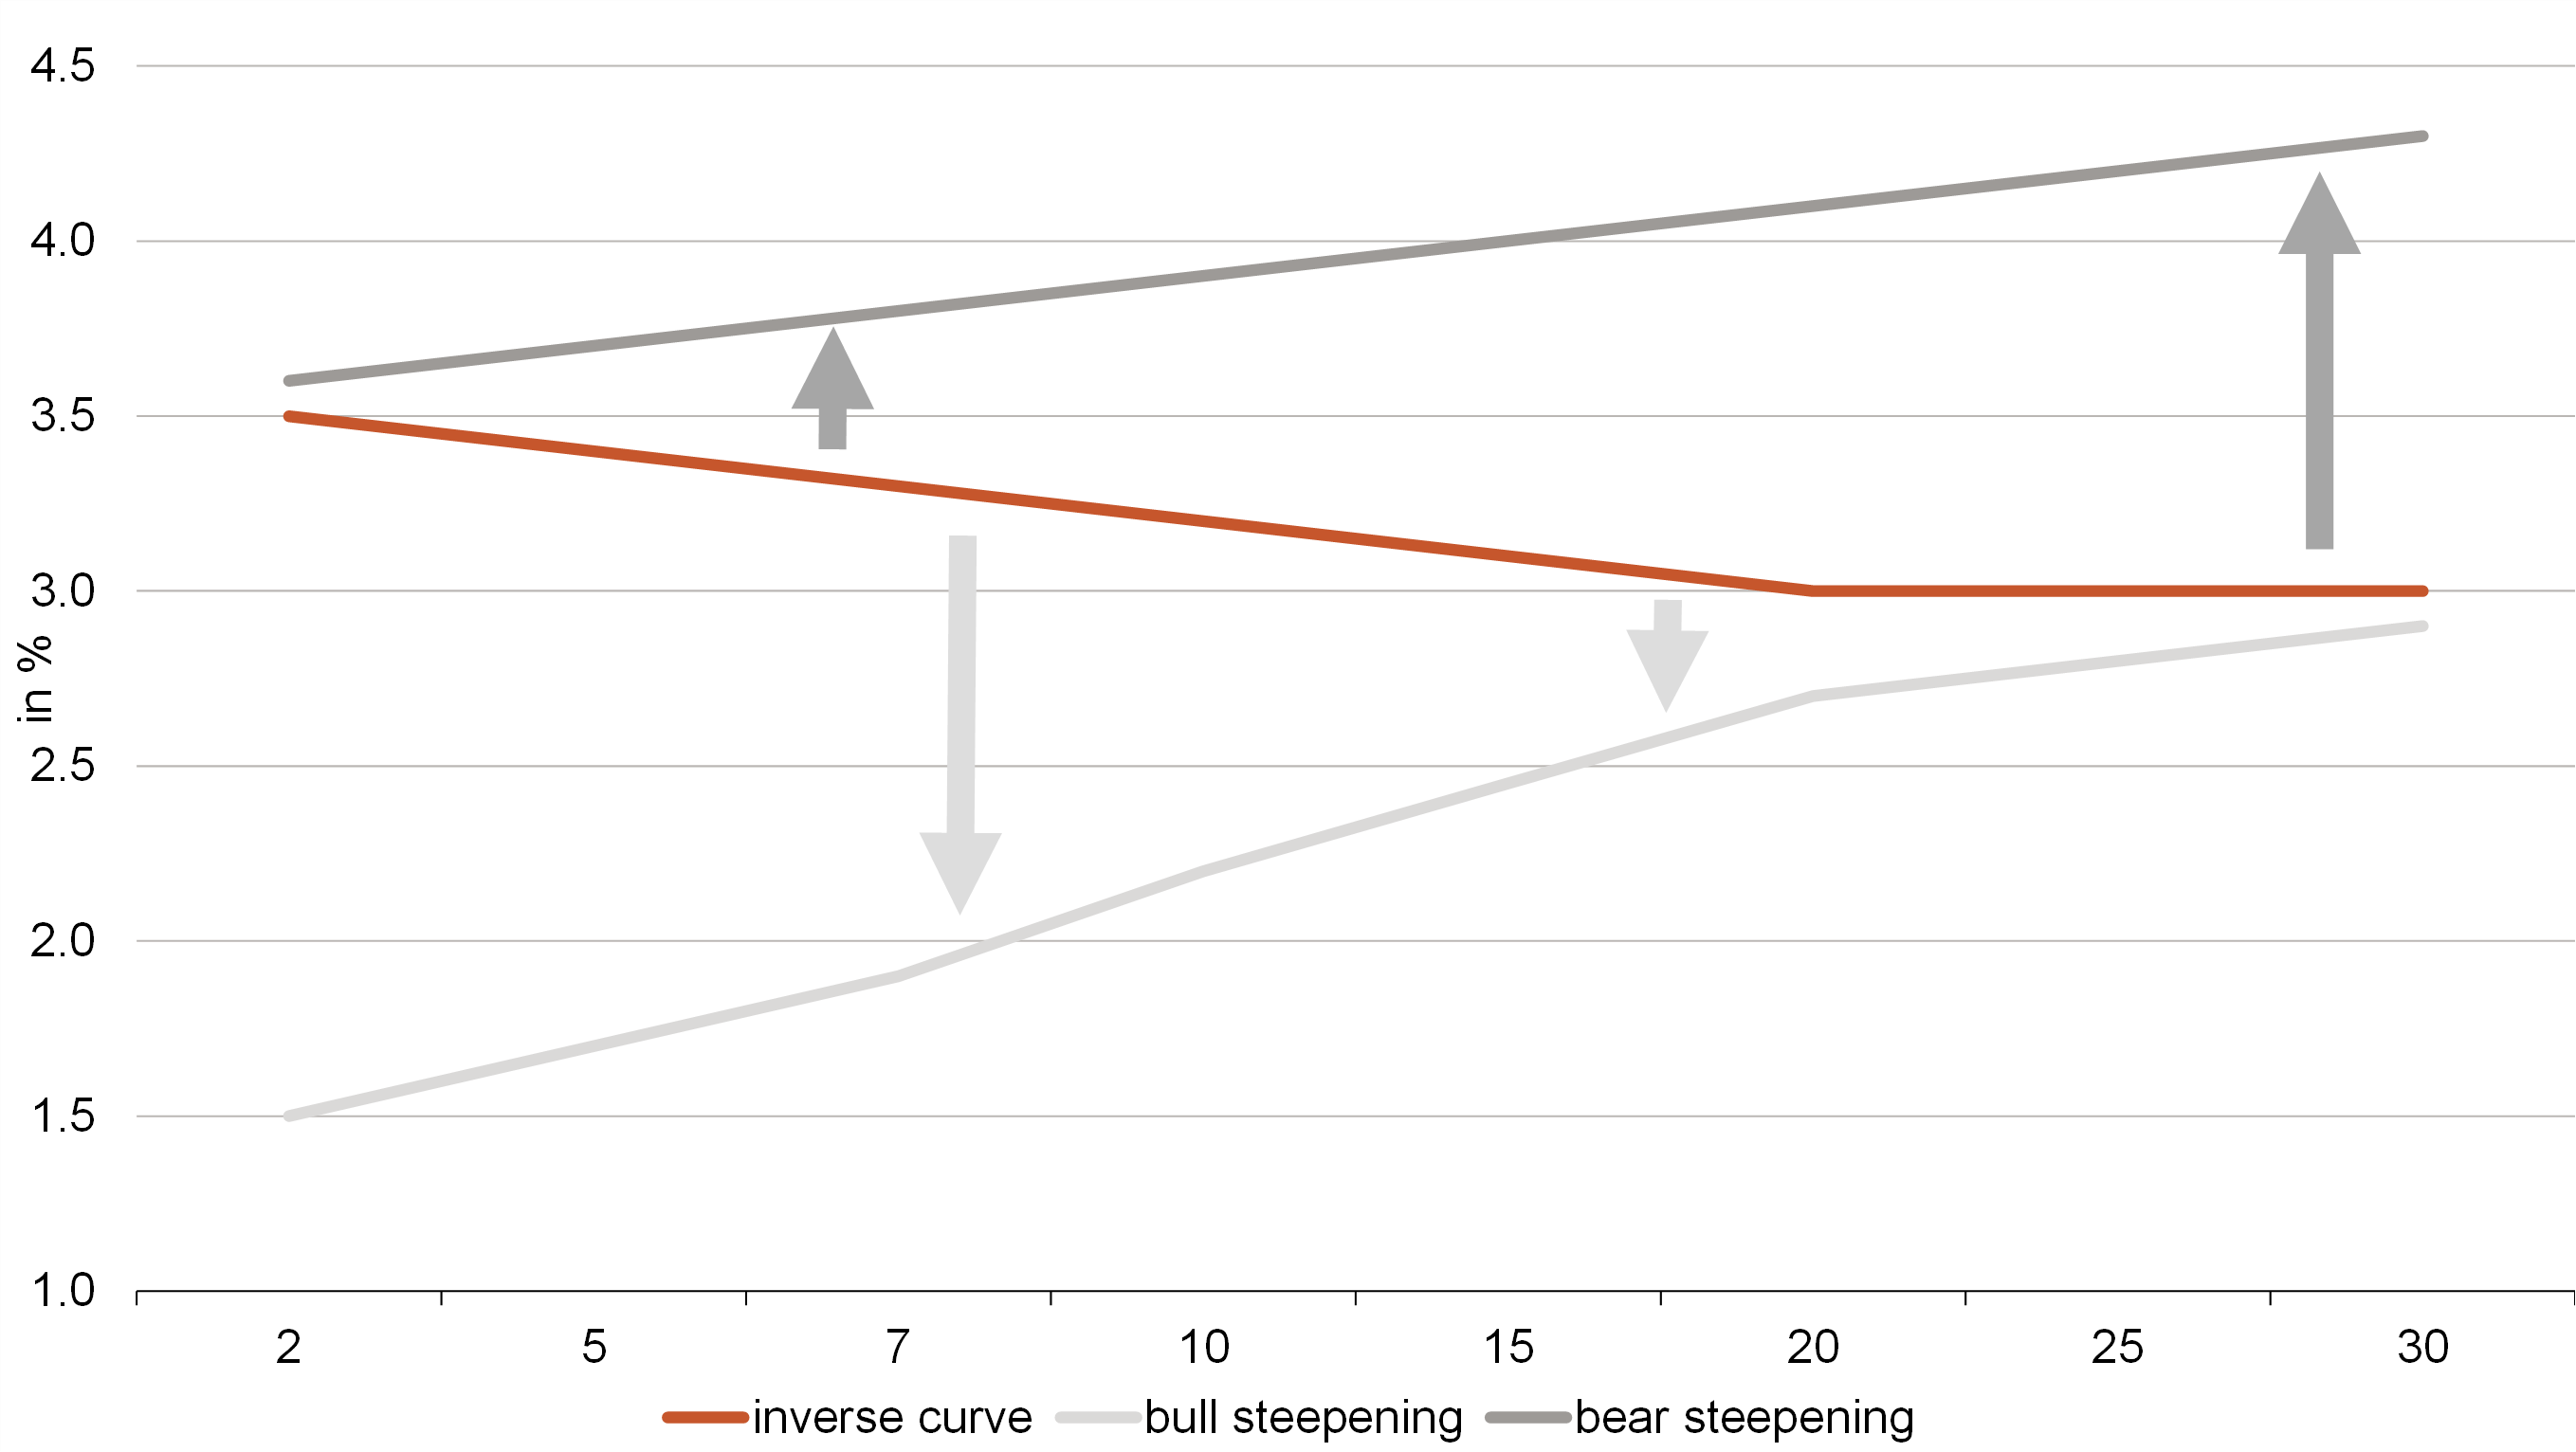
An important question for the coming months is therefore how the inversion will resolve and how steep the curves could become. In the past, it often resolved itself in a so-called “bull steepening” (see Figure 7). The entire curve falls, which is positive and therefore “bullish” for bond performance. However, the front end falls more sharply than the middle and back end and the curve normalises again (rising curve). In order to profit from rising bond prices, investors should therefore position themselves at the point on the curve where the price effect is biggest. This is because even if short-term interest rates fall more in absolute terms, they have a shorter duration and the positive price effect could be significantly greater at another point on the curve.
However, the positive steepening could also return if long-term interest rates rise more strongly than short-term rates, known as “bear steepening” (see Figure 7). This is often triggered by an increased supply of longer-term government bonds that meets with little demand. Some EU member states are already struggling with very high government deficits. If the financial market questions the long-term debt sustainability of these countries, such a movement could occur. The geopolitical situation is also putting pressure on national budgets, as defence spending is likely to increase in the medium term. This would probably have serious consequences for the current situation, in which we are still struggling with a weakened economic performance in Europe, as the willingness to invest would be further dampened and future growth would be additionally burdened. However, this is not expected in the short term.
Figure 7: Bonds usually benefit from bull steepening while they suffer price losses during bear steepenings
Since the introduction of the euro, the ECB has only implemented one major phase of interest rate cuts: 2008-2009 from 3.25% to 0.25%. From the maximum value of the inversion at that time, ie 21bp, the difference between the maturities rose to 195bp during the last interest rate cut of the cycle. This means that the front end benefited more. However, it took almost a year from the first to the last rate cut. This time it could look a little different, as the economic contraction has so far been much weaker and most European countries are already back in economic recovery.
Figure 8: Interest rate cuts in the past led to an increase in steepness
Implications for investments
Now that the theoretical background and the mode of action of monetary policy have been illuminated, one important question remains unanswered – namely, the implications for the optimal duration positioning of a bond portfolio in the coming months.
The basic scenario for the coming weeks and months is clear: the ECB will lower the key interest rate further and the yield curve will steepen significantly again. However, many questions remain unanswered, such as whether there will be a bull or bear steepening. This will depend, among other things, on the geopolitical situation and fiscal measures in Europe. We do not expect the ECB to be able to cut the key interest rate to 0% again on a sustained basis (at least within the current interest rate cycle). This is primarily due to structural drivers of inflation, such as labour shortages and the associated wage pressure. The decline in yields for shorter maturities is therefore also limited. Due to the spread, the yield potential for longer maturities also appears limited. We therefore assume that medium maturities (3-7 years) will particularly benefit from the interest rate cuts. Active duration positioning therefore enables us to realise both strategic and tactical opportunities and thus generate added value for portfolios.

Maria Ziolkowski
Maria Ziolkowski has been with the company since September 2023. She has been a co-portfolio manager since then and focuses on interest rate products and defensive bonds from the investment grade segment as well as short-dated bond strategies.
Before joining Berenberg, she worked at Flossbach von Storch as a portfolio manager in the fixed income area and trader in the multi-asset area, at BNP Paribas in London and Lisbon and at Allianz Investment Bank in Vienna. In addition to her Bachelor in Economics from the Vienna University of Economics and Business, Master in Monetary and Financial Economics from the University of Lisbon and Master in Gender Studies from the University of Vienna, Maria Ziolkowski is a CFA Charterholder

Felix Stern
Felix Stern joined Berenberg Asset Management more than 25 years ago as a fixed income portfolio manager. Today, the Senior Portfolio Manager heads the Fixed Income Euro Balanced team and is responsible for the selection of defensive bonds from the investment grade segment as well as specializing in short-dated bond concepts. He is also the main portfolio manager responsible for several Berenberg mutual funds. After several years in the market research department of British American Tobacco (Germany) GmbH, the trained industrial clerk switched to fixed income portfolio management at the beginning of 2000. The graduate in business administration completed his studies part-time at the distance learning university in Hagen and also obtained a degree as CCrA - Certified Credit Analyst (DFVA) as well as CESGA – Certified ESG Analyst (DVFA).


